Discussion
The AI Bubble in 2026: Capex, Revenue, and the Adaptation Gap
Hyperscaler capex is approaching three quarters of a trillion dollars in 2026 while AI revenue and adoption lag behind. A data-driven look at the gap, the burst scenarios, and the signals to watch.
The AI Bubble in 2026: Capex, Revenue, and the Adaptation Gap
The AI bubble 2026 debate has become a question of timing. Infrastructure spending is accelerating, useful products are selling, and businesses are still learning how to turn model capabilities into dependable operations. Can revenue and productivity catch up before investors demand a different price for the risk?
As of October 2, 2026, the latest guidance from Amazon, Alphabet, Microsoft, and Meta implies approximately $730 billion in combined annual capital expenditure. That is a substantial commitment, but it is neither a clean measure of AI-only investment nor proof of a bubble. Some spending supports existing cloud services, advertising, logistics, and infrastructure used over many years. The harder question is whether the incremental capacity earns an adequate return.
This discussion separates reported results, management guidance, analyst estimates, and hypothetical scenarios. It examines AI capex vs revenue, the AI adoption gap, potential triggers for repricing, and the conditions that could extend the buildout. For readers following the wider business implications, the Omega Plus Journal connects these market questions with practical deployment decisions.
What hyperscalers are actually committing in 2026
Guidance is a spending plan
Amazon expects approximately $220 billion, Alphabet $195–205 billion, Microsoft approximately $175 billion, and Meta $130–145 billion. Together, those endpoints imply $720–745 billion; the midpoint is $732.5 billion. Calling this roughly $730 billion is reasonable rounding. Adding Oracle produces a different aggregate. Amazon and Alphabet's increases were covered in AP's July earnings reporting; Microsoft and Meta provide their outlooks directly.
The table uses one transparent revenue denominator: reported revenue for the quarter ended June 30, multiplied by four. This annualized run rate is a calculation, not company guidance for full-year revenue. Microsoft's quarter is fiscal Q4 2026; the others report calendar Q2. Amounts are US dollars, rounded to billions.
| Company | Calendar 2026 capex guidance | Reported June-quarter revenue | Annualized quarterly revenue | Capex / annualized revenue |
|---|---|---|---|---|
| Amazon | ~$220B | $200.6B | $802.4B | 27.4% |
| Alphabet | $195–205B | $119.8B | $479.2B | 40.7–42.8% |
| Microsoft | ~$175B | $90.0B | $360.0B | 48.6% |
| Meta | $130–145B | $60.8B | $243.2B | 53.5–59.6% |
Methodology: capex figures come from public guidance and may change. Ratios are editorial calculations using rounded reported revenue, with no seasonal adjustment. These are company-wide measures, not AI revenue or AI ROI. Lease treatment differs between companies.
Why percentage comparisons need a denominator
Estimates such as Microsoft at 67%, Meta at 62–72%, Alphabet at 45–47%, and Amazon at 28% should not be presented as one verified, comparable 2026 table. Different revenue periods and spending definitions can produce different ratios. Microsoft's latest guidance also reflects a shift in lease classification, with investment expectations otherwise unchanged. A lower reported capex number can therefore coexist with the same physical buildout.
AI capex vs revenue: follow the money through the stack
Supplier sales are real; final demand is another test
Nvidia reported $89.0 billion in data-center revenue in fiscal Q2 2027, up 117% year over year, in its August 26 earnings release. The fiscal label refers to a quarter ending in July 2026. This is verified supplier revenue. It demonstrates purchases of infrastructure; it does not establish the eventual profitability of the buyers' AI services.
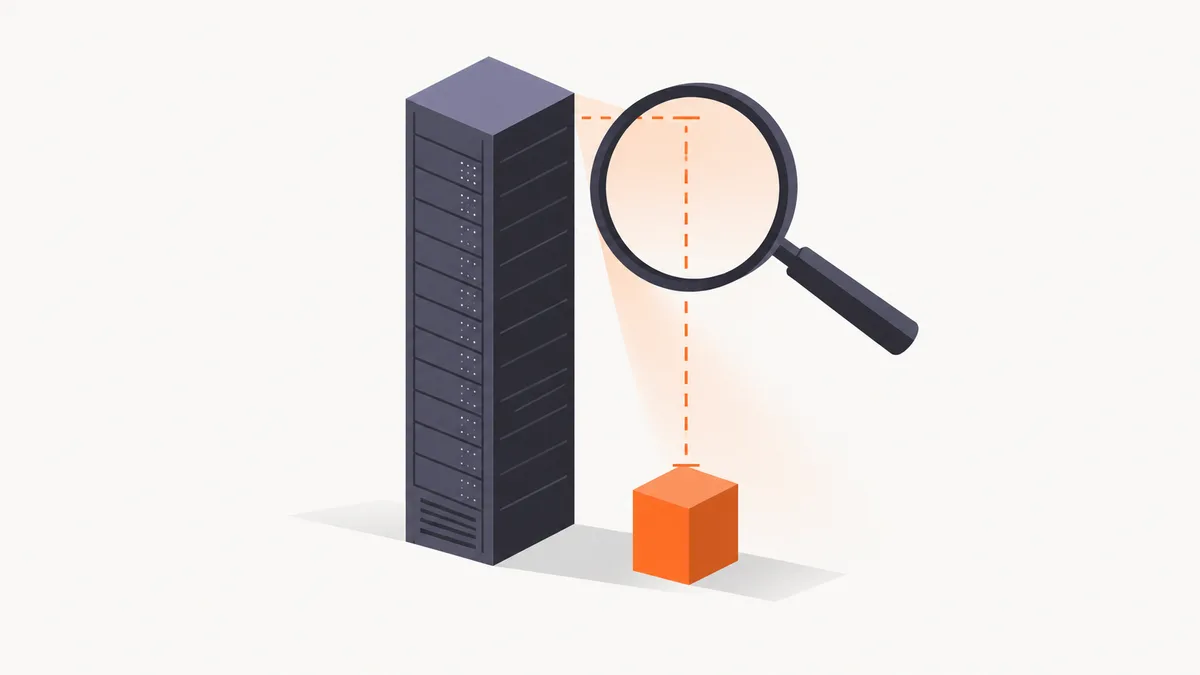
Money can appear at several layers. A business pays an application provider, which buys inference from a model company, which rents cloud capacity, whose operator purchases chips. Adding every layer's revenue would count the same underlying demand repeatedly. Comparing all hyperscaler capex with only chatbot subscriptions creates the opposite problem: it omits other monetization and includes unrelated investment.
AI revenue has an attribution problem
September MIT Technology Review reporting cited Gary Gensler's estimate of $150–200 billion in AI revenue for 2026. Treat that as an estimate with a particular scope, not an audited industry total directly comparable with $730 billion of company-wide capex.
AI can also improve ad targeting, software retention, developer productivity, or search monetization without appearing as a separate revenue line. These benefits matter, but attribution needs a credible counterfactual: what would the business have earned without the investment? A full cloud segment includes conventional computing. An AI-assisted sale is not automatically incremental. API builders consulting the Omega Plus integration documentation should make the same distinction between gross usage and the economic outcome it supports.
The enterprise adoption evidence is improving, unevenly
Broad use does not guarantee measurable productivity
The 2026 working paper Firm Data on AI, also issued by NBER, surveyed nearly 6,000 executives across the United States, United Kingdom, Germany, and Australia. It found 69% of firms used some AI technology. However, 89% reported no labor-productivity impact over the preceding three years. Fieldwork was conducted in late 2025 and early 2026.
That is evidence of a gap between use and firm-level results, not proof that every individual tool failed. The paper measures labor productivity as sales volume per employee. An employee can write faster while company output barely changes because approvals, customer demand, or another process remains the constraint.
September data challenge the blanket failure narrative
BCG's September 30 Applied AI Index announcement, based on 1,330 executives and senior leaders, found 7.5% of companies in its most advanced group and another 41% scaling AI. Together, nearly half were capturing meaningful value. It also found only 5% had the full controls needed for autonomous agents. These are survey findings and maturity classifications, not audited causal estimates of returns.
BCG's September IT Spending Pulse, using May fieldwork with 423 respondents, reported weighted-average measured ROI of 13.8% for generative AI and agents, versus 11.2% in mid-2025. BCG notes that a changing mix of respondents explains part of the increase. Neither this ROI measure nor the sample matches the broader executive paper.
The defensible conclusion is that adoption is spreading and some implementations pay, while organization-wide gains remain uneven. Surveys with different dates, populations, and definitions cannot be combined into a single universal success rate. A useful next step is to examine a bounded implementation such as retrieval-augmented generation for small businesses in 2026, where answers, supervision, and costs can be evaluated directly.
Why the AI adoption gap is really an adaptation gap
Buying capability is faster than changing work
The adaptation gap is the distance between available AI capability and an organization's ability to use it repeatedly, responsibly, and profitably. Access is only the beginning. Someone must prepare data, establish permissions, connect systems, define acceptable quality, change responsibilities, and own exceptions. Infrastructure can be ordered centrally while these changes happen team by team.
MIT Sloan's September 9 research announcement describes substantial hidden work: experimentation, collaboration, output review, and continual adaptation. In one organization studied, more than 80% of domain experts disengaged from AI innovation efforts. This is a case finding, not a population-wide failure rate. It shows how unsupported work can drain an initiative after initial enthusiasm.
The constraint moves downstream
A sales assistant may create proposals quickly, yet legal review still limits throughput. A coding tool may generate more changes while maintainers spend longer reviewing them. A support assistant may draft accurate answers but lack permission to resolve the account issue. More tokens can increase activity without increasing completed work.
Futurum's September pilots-to-production report similarly identifies process redesign, governance, and change management as barriers. It was published in partnership with Google Cloud, a relevant commercial context. Its execution argument supports a practical interpretation: the gap can narrow through organizational investment even without another model breakthrough. Teams exploring Omega Code for development workflows should evaluate completed, accepted changes alongside generation speed.
What AI ROI must cover before the buildout pays
Revenue growth is only the first layer
Capital expenditure purchases assets. Revenue records sales. Return on invested capital asks whether operating profit justifies the capital committed. Free cash flow asks what cash remains after operating needs and investment. These measurements answer different questions, and strong revenue can coexist with weak cash generation during a buildout.
Consider an illustrative $100 billion investment. At an assumed 10% annual return requirement, it needs $10 billion in annual returns on that capital. At an assumed 25% operating margin, generating that amount of operating profit would imply $40 billion in revenue, before refining the model for taxes and timing. These are hypothetical inputs, not an industry forecast.
The assets have different economic lives
A powered building may remain useful far longer than its accelerators. Accounting depreciation spreads cost over an estimated life, but economic obsolescence depends on efficiency and competing hardware. Extending an accounting life improves reported earnings temporarily; it does not create customer demand or remove replacement needs.
Application teams face an equivalent calculation. Savings should subtract inference, integration, human review, retries, and maintenance. Our guide to reducing CLI agent token usage in 2026 addresses one controllable cost. Token efficiency helps, but the decisive metric is cost per successfully completed task at the required quality.
Keep realized savings separate from potential capacity. If an assistant saves drafting time but employees spend the same working hours on additional tasks, the benefit may be better service or higher output rather than a lower payroll bill. If that additional output has no buyer, its financial value is uncertain. Conversely, avoiding an external contractor invoice can create observable cash savings without a dramatic change in employee productivity. A credible ROI report identifies which benefit occurred, who captured it, and whether it persists after implementation costs and ongoing supervision.
What would trigger an AI bubble burst?
Demand disappointments become financial disappointments
A plausible trigger is paid demand growing more slowly than capacity commitments. Enterprise renewals could weaken, pilots could remain pilots, or customers could switch to cheaper alternatives. Operators might lower prices to preserve utilization, reducing the cash available to service financing. Suppliers could then receive fewer new orders despite a large installed base.
Efficiency is ambiguous. Cheaper inference can unlock applications and expand demand. It can also reduce spending per task faster than usage grows. The relevant question is whether paid volume expands enough to support the infrastructure economics. Model improvement alone cannot answer it.
Financing can shorten the waiting period
Goldman Sachs credit research, reported by Yahoo Finance on July 28, projected approximately $1.14 trillion in hyperscaler capex for 2027 and $400 billion in investment-grade bond issuance. Its group includes Oracle. These are analyst estimates; bond issuance equivalent to around 35% of capex is a financing comparison, not proof that each issued dollar funds a particular project.
More expensive refinancing, weaker collateral values, or less patient lenders could turn a manageable adoption delay into a funding problem. A recession could simultaneously weaken advertising cash flows and enterprise software budgets. Power delays could postpone revenue while interest accrues. Markets can reprice those risks before a data center opens. No trigger requires AI to stop being useful.
What a burst would actually look like
A spending slowdown can arrive before defaults
A mild correction would involve lower valuation multiples, slower capex growth, tighter procurement, and consolidation among weaker vendors. A more severe investment downturn could bring canceled campuses, discounted GPU rentals, asset impairments, and restructurings. A financial spillover would require losses to propagate through creditors and counterparties; it is not an automatic consequence of falling technology stocks.
Omdia's December 2025 Cloud and Data Center Market Snapshot offers a dated scenario framework. Its bubble case assumed productivity gains arrived too slowly and investors lost patience. Data Center Dynamics' coverage described capex falling from approximately $1.4 trillion in 2027 to just over $1 trillion in 2028. Omdia assigned that scenario a 5% likelihood at publication; that is not a current market probability or a verified forecast of a crash.
Overcapacity can coexist with local shortages
Those figures cover broader data-center investment than the four-company table. Even the downside scenario retains substantial spending. A market can have surplus older accelerators while lacking suitable power, networking, or high-density capacity elsewhere. Data center overcapacity is therefore a question of location, hardware, contracts, and price, rather than one global vacancy number.
Who is most exposed to the mismatch?
Cash flow and commitments determine resilience
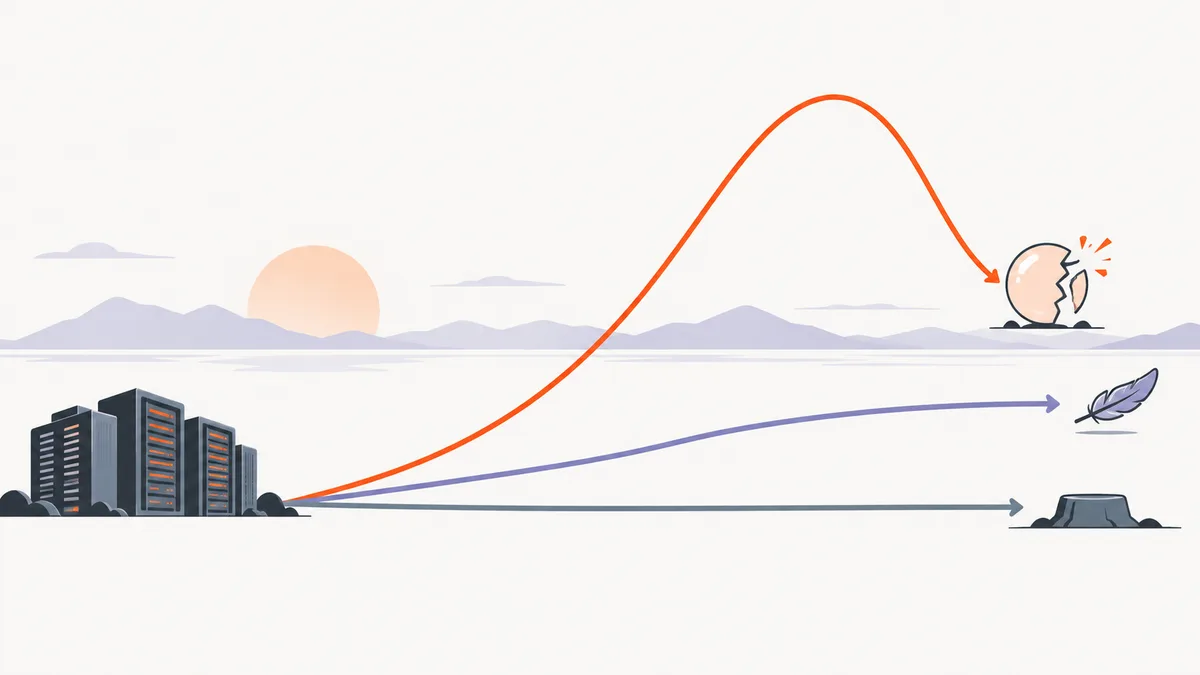
The most exposed business model combines concentrated customers, large fixed commitments, depreciating equipment, and dependence on fresh financing. That combination can occur in a GPU cloud operator, a speculative data-center developer, or a model company purchasing compute ahead of revenue. Exposure should be assessed through contracts and cash flows rather than an AI label.
The large hyperscalers have established businesses that can help fund a transition. Microsoft and Amazon sell cloud and enterprise services; Alphabet and Meta generate substantial advertising revenue. That creates flexibility, not immunity. If core businesses weaken while infrastructure payments continue, the funding cushion shrinks. High capex intensity matters more when operating margins and collections also deteriorate.
Suppliers and lenders face different risks
Nvidia and other equipment vendors face order growth, pricing, and customer-concentration risk. Their buyers face utilization, operating costs, and residual asset values. Developers, utilities, and construction firms face project timing and counterparty exposure. Private-credit investors and banks must examine guarantees, collateral, and refinancing obligations. A financially strong tenant does not make every associated financing structure equally secure.
Application businesses with modest fixed commitments may benefit from cheaper capacity while still suffering tighter funding or provider disruption. Customers should preserve data portability and tested alternatives. Using the API documentation to define integration boundaries is a practical start; resilience still depends on application design and contractual rights.
How long can the adaptation gap last before repricing?
Organizations and markets run on different clocks
Enterprise adaptation can take multiple budget cycles because workflow redesign, procurement, and training are sequential. Equity prices can adjust immediately when expected future cash flows change. Credit pressure depends on payment schedules and refinancing dates. Hardware competitiveness follows another clock. There is no universal number of years that markets must tolerate an adoption gap.
Our analytical view is that 2027–2028 will provide a consequential test as more committed capacity meets recurring demand. This is a monitoring window, not a prediction of a burst. Omdia's older scenario also identified 2027 as important because developers had revenue commitments for that year. Different firms can reach their financial limits much earlier or keep funding investment much longer.
Evidence buys time; narrative eventually runs out
Investors can tolerate low near-term cash flow when retention, customer expansion, unit economics, and future contracted revenue strengthen. Patience becomes harder to justify when successive spending increases are accompanied by delayed monetization or worsening margins. A backlog helps only if counterparties can pay and delivery becomes profitable revenue.
The gap can last while expected returns remain credible and funding remains available. It can close through higher application value, better integration, lower costs, or reduced investment. An unchanged gap becomes dangerous when assets age and obligations accumulate faster than customers' willingness to pay.
AI market outlook 2027: track outcomes and competing explanations
The bull case has observable evidence
Microsoft's June-quarter release reported more than 30 million paid Microsoft 365 Copilot seats and Azure growth of 43%. These are evidence of commercial uptake, although neither establishes the return on the entire investment program. BCG's newer value findings also support the possibility that operational adaptation is progressing.
The bull case is that capacity enables products whose demand becomes durable, while better software expands useful work per dollar. The bear case is that usage grows but monetization and margins cannot justify the assets. Both can hold in different parts of the market: successful applications do not guarantee attractive returns for every infrastructure owner.
Watch a small set of leading indicators
- Demand quality: paid renewals, customer expansion, and externally funded customers rather than promotional usage alone.
- Economics: gross profit, free cash flow, replacement needs, and inference cost per completed task.
- Capacity: commissioned power, realized utilization, rental prices, and deferred projects.
- Financing: borrowing costs, guarantees, repayment schedules, and dependence on another funding round.
Barron's historical capex discussion emphasizes uncertain timing. HBR's September bubble discussion adds a leadership perspective. Historical analogies are useful prompts; they cannot supply a mechanical expiration date for this cycle.
How businesses should respond while the debate continues
Make small deployments prove their economics
Choose a repeated process with a measurable baseline, representative inputs, and an accountable owner. Compare quality, completion time, supervision, and total cost with the existing process. Release gradually, capture corrections, and require evidence before expanding. A useful pilot should answer whether customers or employees finish valuable work more reliably.
For a development pilot, start with a bounded task using the Omega Plus downloads, then measure accepted outcomes. For knowledge retrieval, evaluate whether staff locate current, permitted evidence and resolve the original request. Discount claimed time savings when saved minutes cannot be redeployed or when review consumes them.
Keep commitments proportional to demonstrated value
Preserve the ability to change providers, export data, reduce usage, and continue essential operations. Separate experimental capacity from recurring production requirements. A market correction may improve infrastructure prices while making suppliers less predictable. Teams with measurable value and manageable commitments can keep building through either outcome.
The immediate task is to narrow the adaptation gap inside the organization. That means supporting integration, domain expertise, evaluation, and ongoing maintenance. Better execution creates real demand; another dashboard showing more generated tokens does not.
Frequently asked questions about the AI bubble in 2026
Will the AI bubble burst in 2026?
No verified evidence establishes a burst date. Spending commitments and commercial uptake are real, while future returns remain uncertain. Repricing could occur during 2026 or later if expectations deteriorate. A decline in valuations would not mean useful AI products disappear.
What triggers an AI bubble burst?
A credible trigger is paid demand missing expectations while fixed costs and financing obligations keep rising. Weak renewals, falling capacity prices, tighter credit, or delayed projects could expose the mismatch. Usually several pressures reinforce one another rather than a single statistic deciding the outcome.
Which companies are most exposed?
Exposure is highest where customer concentration, fixed compute commitments, aging hardware, and financing dependence overlap. Highly leveraged operators and speculative projects warrant particular scrutiny. Established hyperscalers have more funding options, but returns and shareholder valuations can still suffer.
Is this like the dot-com bubble?
The similarity is investment arriving ahead of proven demand and profits. The difference is that today's leading infrastructure buyers have substantial existing businesses. The dot-com comparison shows that durable technology and poor investment returns can coexist; it does not predict this cycle's timing or severity.
What is the AI adoption gap?
It is the distance between access or experimentation and repeated, valuable business use. The adaptation gap emphasizes the work needed to close it: data preparation, workflow changes, integration, training, evaluation, and accountability. Survey adoption percentages measure only part of that process.
How long can AI spending outrun revenue?
There is no fixed deadline. Funding strength, contracts, asset lives, and credible improvement determine the runway. Markets can reprice before operational losses emerge. The 2027–2028 period is a useful observation window, while each company's obligations require their own analysis.
Editorial disclosure: Omega Plus Media Team publishes this analysis for the Journal. Company guidance, analyst estimates, and scenarios are identified separately; sources were reviewed through October 2, 2026.
Sources and further reading
- MIT Technology Review: September 2026 reporting on AI's trillion-dollar gamble.
- HBR: The Questions You Should Be Asking About the AI Bubble.
- Yahoo Finance: Goldman Sachs' July 2026 capex and debt projections.
- Omdia: Cloud and Data Center Market Snapshot, December 2025.
- Barron's: AI capex and historical investment cycles.
- Futurum: From Pilots to Production, September 2026.
- Microsoft: Fiscal 2026 fourth-quarter earnings call and investment guidance.
- Nvidia: Fiscal 2027 second-quarter financial results.